
15 Jul What is an Inverted Yield Curve and Does it Matter?
March 28, 2019
By Sterling Neblett
Centurion Wealth Management
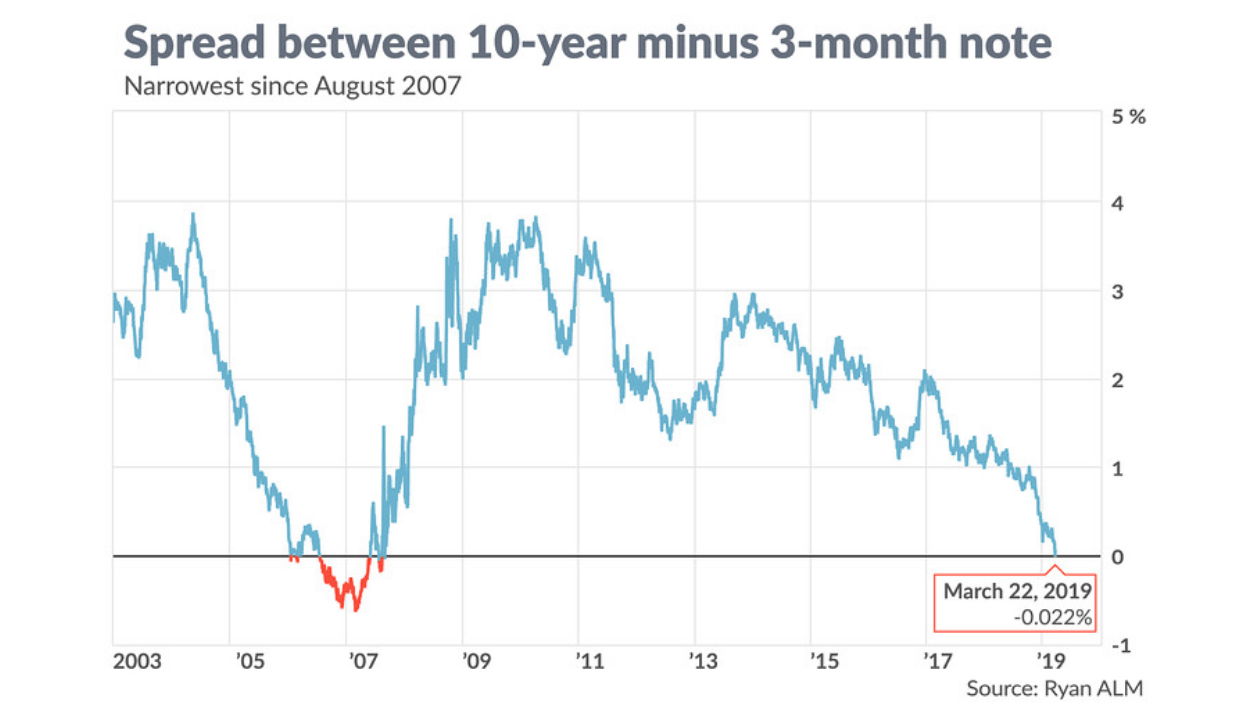
On Friday, March 22nd the yield of the United States Ten-year Treasury Note dropped below that of the Three-month Treasury Bill for the first time since August of 2007. This situation does not often present itself, but when it does; economists sit up and take notice. The green eyeshade gang notes that most often when the yield curve “inverts” an economic recession follows.
For clarification, the fluctuating quotes for yields on U. S. Treasuries refer to the total return for the period of time involved or yield to maturity (YTM). YTM takes into account the price paid for the bond ($1000+/-), the coupon rate of interest established when the bond was issued, and the exact length of time until maturity or redemption measured in days. Simple YTM calculators can be found online, but the pros often use their trusty handheld calculators for more exacting results.
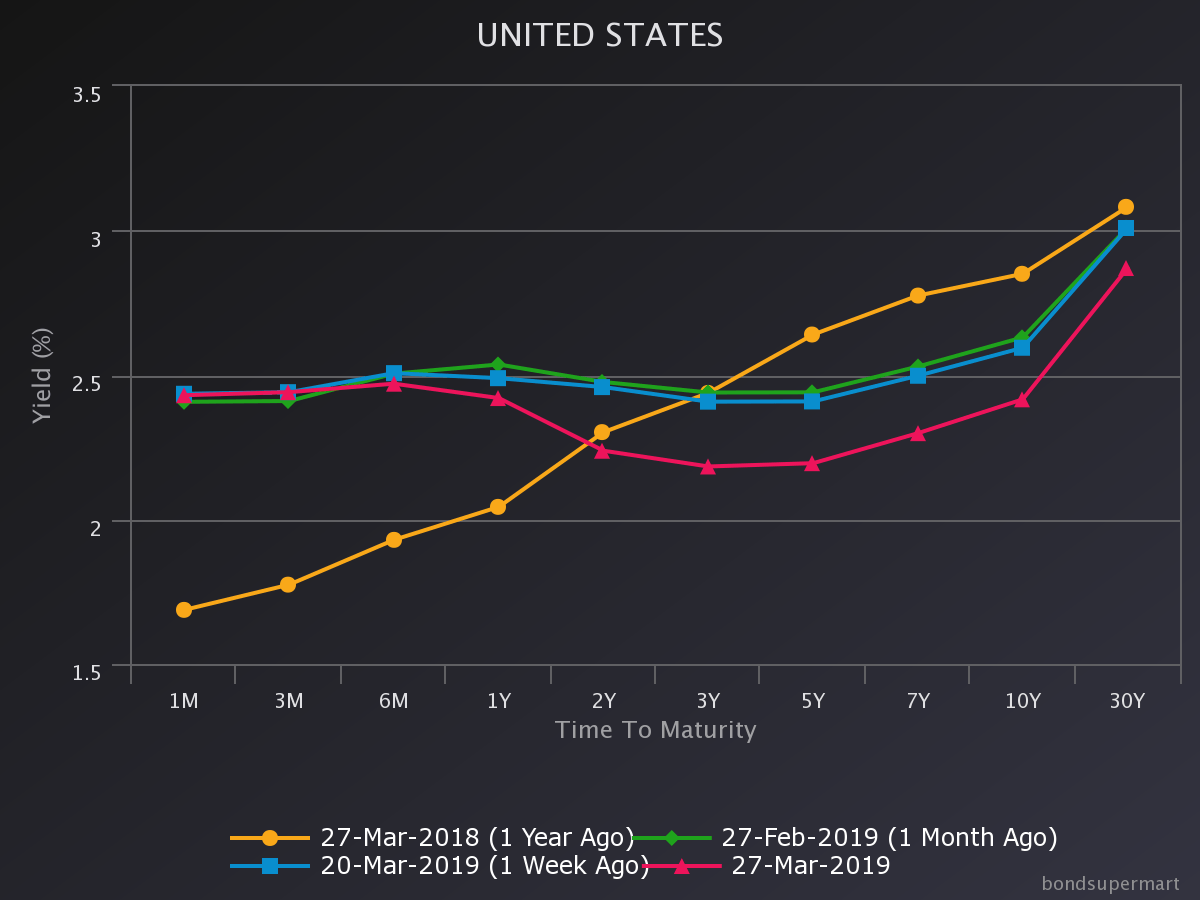
The yield curve is so-named because it “normally” curves upward from left to right, from short to long, but no longer as of Friday. The current graph of yields from shortest to longest now slopes ever-so-slightly downward as it proceeds rightward from the three-month bill at 2.44% toward the ten-year maturity at 2.39%. This could be a tipping point for interest rate predictions and economic forecasts, but much depends upon whether this trend continues and for how long. The current yield curve as eyeballed from a distance would better be described as “flattened.”
Current U. S. Treasury Yield Curve
Source: bondsupermart
Previous yield curve inversions have preceded economic recessions, but buyers of long maturity bonds during yield curve inversions have not been penalized for their reactive investment decisions. The most extreme examples are found in the early 1980s when two yield curve inversions preceded two recessions in a very short economic timeframe, The Federal Reserve, led by Paul Volcker, raised the Federal Funds Rate to over 20%. Three-month Treasury Bills then yielded 18% while yields on the 10-year T-notes and 30-year T-bonds reached as high as 15%. Those many savers who bought the highest yields available made a historic investment blunder, while those happy few who bought and held 13% 30-year US Treasury Bonds, when last they were offered in 1984, beat the stock market averages for the next three decades with a single purchase. The 13% 30-year bond issued in 1984 paid $130 per year until 2014 then returned the $1000 investment upon redemption.
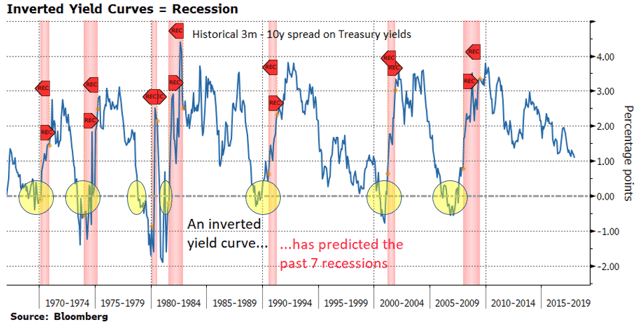
Again in the late 1980’s the yield curve inverted when the Fed Funds rate reached nearly 10% and the 30-Year Treasury paid 8.95%. When last the yield curve inverted in 2007, the Fed Funds Rate was 5.25%, the 10-year Treasury 4.71%, and the 30-year 4.87%. Interest rates that high have not been seen since and may not be seen again.[/vc_column_text][/vc_column]
So the question is whether 2.4% guaranteed for ten years by the United States Treasury is now the smart choice again. Outsized investments in long-term Treasuries over the last six months by global financial concerns have driven the price of U. S. Treasuries upward and their yields downward. Does the big money know something, or is it just a knee-jerk reaction by the most hyper-conservative investors? For comparison, consider that that German 10-year Government Bonds pay -0.08% and a buyer today will have received, in 2029, less than the amount invested.
Some bond investors have already profited from the drop in long-term U. S Treasury yields. On November 8th, the Ten-Year Treasury Note carried a yield of 3.24%. The coupon rate was 2.875%, so it was priced at a discount to its maturity value. That bond sold that day for $969 per $1000 bond and then closed at $1041 (2.374% YTM) on March 27, 2019. The market price of the Ten-year U. S. Treasury gained 7.46% (21.1% annualized) in that period of time while the stock market was flat.
U. S. Ten-Year Treasury Yield Chart
Source: Wall Street Journal
Market price gains for the 10-year T-note may not be over. The 10-year T-note yield reached as low as 1.37% on the Fourth of July 2016. A move this year to that previous low yield would push the price of the lucky November buyer’s bond to over $1130. Judged by recent treasury auctions, demand is still strong even though yields are already at historically low levels. Also implied by the current shape of the yield curve is an expectation that the next Fed Funds rate move may be lower, not higher.
Stock investors must also take note of this rare yield curve inversion. An economic recession is very bad for the stock market, but lower interest rates will provide support for quality companies. With growing earnings and dividends. Recession, with its accompanying higher unemployment and reduced consumer demand, negatively affects cyclical stocks in industry groups like autos, retailing and services. Banks can also get stingy with their lending during a recession, avoiding the risk of default and turning up their noses at the low interest rates they can charge for customers for loans. But when presented with fixed-income investments at the lowest yields in history, investors return to the stock market as they did between 2009 and 2019.
Stock investors must always be wary of unusual events, like yield curve inversions, which affect investors’ perceptions. Mr. Market is a fickle friend that changes his mood at a whiff of an ill wind, but the average length of time between a yield curve inversion and the beginning of a recession is 18½ months, and the Standard and Poor’s 500 Index gains an average of 21% in those time periods. Vigilant holds of quality stocks are now in order.
The recent yield curve inversion may be the most important economic metric of this decade, or not. It could be different this time. Those famous last words were said before many a market drop, but consider that the recent peak yield of 3.24% for the 10-year T-bond was much lower than its average of 5.79% since 1953. An inverted yield curve seems always to predict an eventual recession, but never before has the yield curve inverted when all bond yields were this low. Investors cannot buy a 3% government guaranteed rate no matter what maturity they buy. So, does the shape of the yield curve matter when all yields on the curve are half their historic averages? Only time will tell.
The views and opinions expressed in this article are those of the authors and do not necessarily reflect the opinions of Spire Wealth Management, LLC, Spire Securities LLC or its affiliates. Investing involves risk, including the loss of principal. Past performance may not be indicative of future results.
Spire Wealth Management is a Federally Registered Investment Advisory Firm. Securities offered through an affiliated company, Spire Securities, LLC a Registered Broker/Dealer and member FINRA/SIPC
Sorry, the comment form is closed at this time.